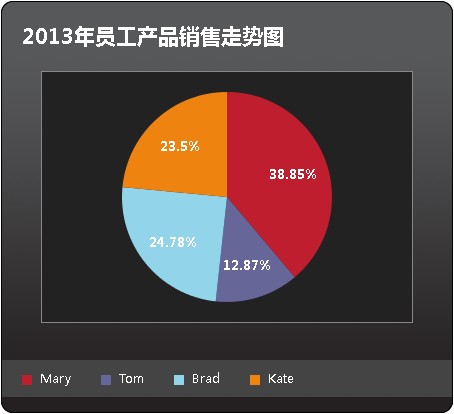
描述:Visualize是一个利用HTML5 Canvas将Tables标签转换成图表的jQuery插件。支持的图表类型包括:线状图,柱状图,饼状图。可以设置图表标题,高度/宽度,颜色等。
图片展示:
兼容浏览器:IE6+/Firefox/Google Chrome
官方链接:http://www.filamentgroup.com/lab/update_to_jquery_visualize_accessible_charts_with_html5_from_designing_with/
JS下载:http://www.ijquery.cn/js/visualize/visualize.jQuery.js 附加JS http://www.ijquery.cn/js/visualize/excanvas.js
预览: http://www.ijquery.cn/study/demo/visualize
打包下载:http://www.ijquery.cn/study/demo/visualize/visualize.zip
参数说明:
type: 'bar', //柱状图,also available: area 线状区域图, pie 饼状图, line 线状图
width: $(this).width(), //height of canvas - defaults to table height
height: $(this).height(), //height of canvas - defaults to table height
appendTitle: true, //table caption text is added to chart
title: null, //grabs from table caption if null
appendKey: true, //color key is added to chart
rowFilter: ' ',
colFilter: ' ',
colors: ['#be1e2d','#666699','#92d5ea','#ee8310','#8d10ee','#5a3b16','#26a4ed','#f45a90','#e9e744'],
textColors: [], //corresponds with colors array. null/undefined items will fall back to CSS
parseDirection: 'x', //which direction to parse the table data
pieMargin: 20, //pie charts only - spacing around pie
pieLabelsAsPercent: true,
pieLabelPos: 'inside',
lineWeight: 4, //for line and area - stroke weight
barGroupMargin: 10,
barMargin: 1, //space around bars in bar chart (added to both sides of bar)
yLabelInterval: 30 //distance between y labels
JS和CSS引用代码:图表的宽度在visualize.css中定义
[js]
<script type="text/javascript" src="http://www.ijquery.cn/js/jquery-1.7.2.min.js"></script>
<script type="text/javascript" src="http://www.ijquery.cn/js/visualize/excanvas.js"></script>
<script type="text/javascript" src="http://www.ijquery.cn/js/visualize/visualize.jQuery.js"></script>
<link href="http://www.ijquery.cn/js/visualize/visualize.css" type="text/css" rel="stylesheet" />
<link href="http://www.ijquery.cn/js/visualize/visualize-dark.css" type="text/css" rel="stylesheet" />
<script type="text/javascript">
$('table').visualize({type: 'pie', height: '250px', width: '370px'}); //饼状图
</script>
[/js]
HTML代码:
[html]
<table style="width:980px;margin:0px 0 0 0;">
<caption>2013年员工产品销售走势图</caption>
<thead>
<tr>
<td></td>
<th scope="col">food</th>
<th scope="col">auto</th>
<th scope="col">household</th>
<th scope="col">furniture</th>
<th scope="col">kitchen</th>
<th scope="col">bath</th>
</tr>
</thead>
<tbody>
<tr>
<th scope="row">Mary</th>
<td>190</td>
<td>160</td>
<td>40</td>
<td>120</td>
<td>30</td>
<td>70</td>
</tr>
<tr>
<th scope="row">Tom</th>
<td>3</td>
<td>40</td>
<td>30</td>
<td>45</td>
<td>35</td>
<td>49</td>
</tr>
<tr>
<th scope="row">Brad</th>
<td>10</td>
<td>180</td>
<td>10</td>
<td>85</td>
<td>25</td>
<td>79</td>
</tr>
<tr>
<th scope="row">Kate</th>
<td>40</td>
<td>80</td>
<td>90</td>
<td>25</td>
<td>15</td>
<td>119</td>
</tr>
</tbody>
</table>
[/html]